The fude package provides utilities to facilitate the handling of the Fude Polygon data downloadable from the Ministry of Agriculture, Forestry and Fisheries (MAFF) website. The word “fude” is a Japanese counter suffix used to denote land parcels.
Fude Polygon data can now be downloaded from two different MAFF websites (both available only in Japanese):
GeoJSON format:
https://open.fude.maff.go.jp
FlatGeobuf format:
https://www.maff.go.jp/j/tokei/census/shuraku_data/2020/mb/
You can install the released version of fude from CRAN with:
install.packages("fude")Or the development version from GitHub with:
# install.packages("devtools")
devtools::install_github("takeshinishimura/fude")There are two ways to load Fude Polygon data, depending on how the data was obtained:
library(fude)
d <- read_fude("~/2022_38.zip")d2 <- read_fude(pref = "愛媛")#> Reading layer `MB0001_2024_2020_38' from data source
#> `/private/var/folders/33/1nmp7drn6c56394qxrzb2cth0000gn/T/RtmpLFmlN7/fileab9d6efb7619/MB0001_2024_2020_38/MB0001_2024_2020_38.fgb'
#> using driver `FlatGeobuf'
#> Simple feature collection with 632287 features and 6 fields
#> Geometry type: MULTIPOLYGON
#> Dimension: XY
#> Bounding box: xmin: 132.0215 ymin: 32.9103 xmax: 133.6916 ymax: 34.29884
#> Geodetic CRS: JGD2000Note: This feature is available only for data obtained from GeoJSON (Obtaining Data #1).
Convert local government codes into Japanese municipality names for easier management.
dren <- rename_fude(d)
names(dren)
#>  [1] "2022_松山市"     "2022_今治市"     "2022_宇和島市"   "2022_八幡浜市"
#>  [5] "2022_新居浜市"   "2022_西条市"     "2022_大洲市"     "2022_伊予市"
#>  [9] "2022_四国中央市" "2022_西予市"     "2022_東温市"     "2022_上島町"
#> [13] "2022_久万高原町" "2022_松前町"     "2022_砥部町"     "2022_内子町"
#> [17] "2022_伊方町"     "2022_松野町"     "2022_鬼北町"     "2022_愛南町"
You can also rename the columns to Romaji instead of Japanese.
dren <- d |> rename_fude(suffix = TRUE, romaji = "title")
names(dren)
#>  [1] "2022_Matsuyama-shi"   "2022_Imabari-shi"     "2022_Uwajima-shi"
#>  [4] "2022_Yawatahama-shi"  "2022_Niihama-shi"     "2022_Saijo-shi"
#>  [7] "2022_Ozu-shi"         "2022_Iyo-shi"         "2022_Shikokuchuo-shi"
#> [10] "2022_Seiyo-shi"       "2022_Toon-shi"        "2022_Kamijima-cho"
#> [13] "2022_Kumakogen-cho"   "2022_Matsumae-cho"    "2022_Tobe-cho"
#> [16] "2022_Uchiko-cho"      "2022_Ikata-cho"       "2022_Matsuno-cho"
#> [19] "2022_Kihoku-cho" "2022_Ainan-cho"Download the agricultural community boundary data, which corresponds to the Fude Polygon data, from the MAFF website: https://www.maff.go.jp/j/tokei/census/shuraku_data/2020/ma/ (available only in Japanese).
b <- get_boundary(d)You can easily combine Fude Polygons with agricultural community boundaries to create enriched spatial analyses or maps.
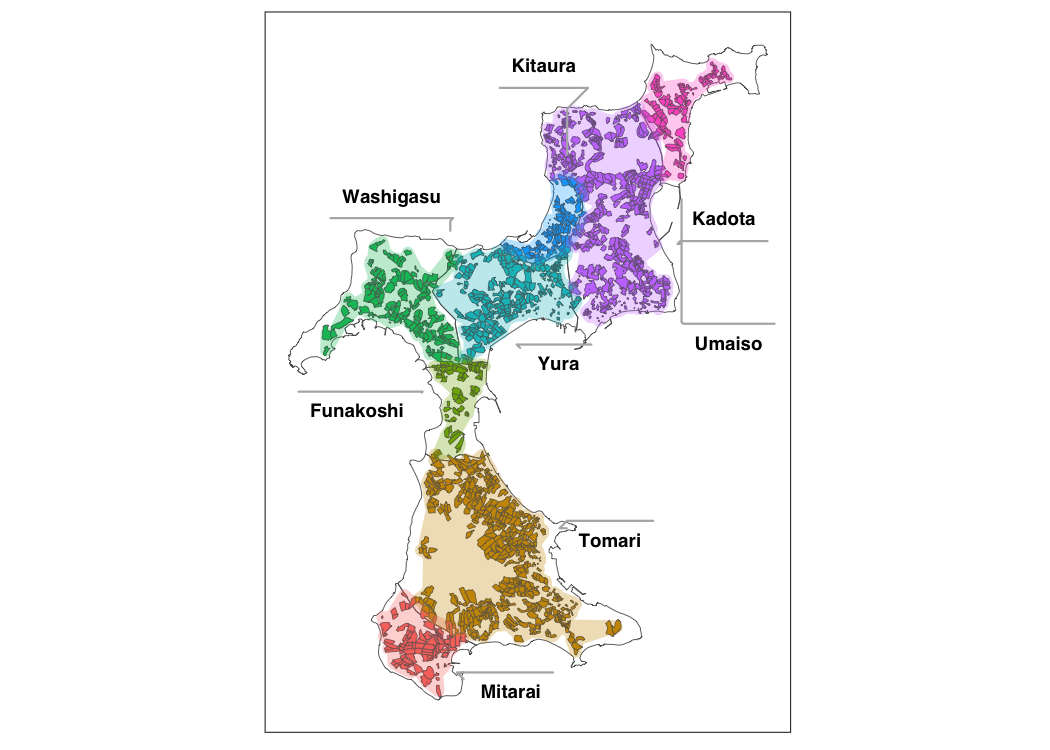
db <- combine_fude(d, b, city = "松山市", community = "由良|北浦|鷲ケ巣|門田|馬磯|泊|御手洗|船越")

library(ggplot2)

ggplot() +
  geom_sf(data = db$fude, aes(fill = RCOM_NAME), alpha = .8) +
  guides(fill = guide_legend(reverse = TRUE, title = "興居島の集落別耕地")) +
  theme_void() +
  theme(legend.position = "bottom") +
  theme(text = element_text(family = "Hiragino Sans"))
出典:農林水産省「筆ポリゴンデータ(2022年度公開)」および「農業集落境界データ(2020年度)」を加工して作成。
db$fude: Automatically assigns polygons on the
boundaries to a community.db$fude_split: Provides cleaner boundaries, but polygon
data near community borders may be divided.library(patchwork)
fude <- ggplot() +
geom_sf(data = db$fude, aes(fill = RCOM_NAME), alpha = .8) +
theme_void() +
theme(legend.position = "none") +
coord_sf(xlim = c(132.658, 132.678), ylim = c(33.887, 33.902))
fude_split <- ggplot() +
geom_sf(data = db$fude_split, aes(fill = RCOM_NAME), alpha = .8) +
theme_void() +
theme(legend.position = "none") +
coord_sf(xlim = c(132.658, 132.678), ylim = c(33.887, 33.902))
fude + fude_split
If you need to adjust this automatic assignment, you will need to write custom code. The rows that require attention can be identified with the following command.
library(dplyr)
library(sf)

db$fude |>
  filter(polygon_uuid %in% (db$fude_split |> filter(duplicated(polygon_uuid)) |> pull(polygon_uuid))) |>
  st_drop_geometry() |>
  select(polygon_uuid, KCITY_NAME, RCOM_NAME, RCOM_ROMAJI) |>
  head()
#>                           polygon_uuid KCITY_NAME RCOM_NAME RCOM_ROMAJI
#> 1 8085bc47-9af5-440f-89e9-f188d3b95746   興居島村        泊      Tomari
#> 2 26920da0-b63e-4994-a9eb-175e2982fe21   興居島村      門田      Kadota
#> 3 ac2e7293-6c2f-4feb-a95f-4729dc8d0aec   興居島村      由良        Yura
#> 4 ea130038-7035-4cf3-b71c-091783090d74   興居島村      船越   Funakoshi
#> 5 4aba8229-1b14-4eab-8a91-e10d9e841180   興居島村      船越   Funakoshi
#> 6 156a3459-25cb-494c-824f-9ba6b0fb6f23 興居島村 由良 YuraThe FlatGeobuf format offers a more efficient alternative to GeoJSON. A notable feature of this format is that each record already includes an accurately assigned agricultural community code.
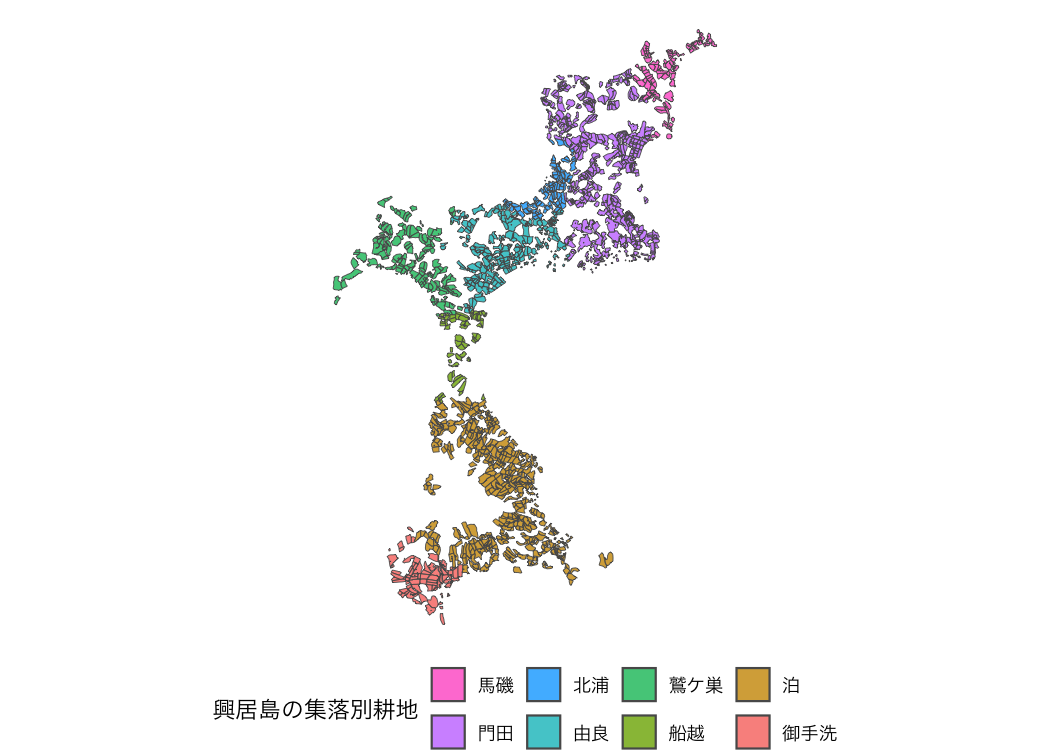
db2 <- combine_fude(d2, b, city = "松山市", community = "由良|北浦|鷲ケ巣|門田|馬磯|泊|御手洗|船越")

ggplot() +
  geom_sf(data = db2$fude, aes(fill = RCOM_NAME), alpha = .8) +
  guides(fill = guide_legend(reverse = TRUE, title = "興居島の集落別耕地")) +
  theme_void() +
  theme(legend.position = "bottom") +
  theme(text = element_text(family = "Hiragino Sans"))
出典:農林水産省「筆ポリゴンデータ(2024年度公開)」および「農業集落境界データ(2020年度)」を加工して作成。
Data enables extraction based on city names, former village names, and agricultural community names.
Note: This feature is available only for data obtained from FlatGeobuf (Obtaining Data #2).
d2 |> extract_fude(city = "松山市", kcity = "興居島")
#> Simple feature collection with 1690 features and 8 fields
#> Geometry type: MULTIPOLYGON
#> Dimension:     XY
#> Bounding box:  xmin: 132.6373 ymin: 33.87055 xmax: 132.6991 ymax: 33.92544
#> Geodetic CRS:  WGS 84
#> First 10 features:
#>                            polygon_uuid land_type issue_year point_lng
#> 1  87a649f2-0385-4daf-81ba-82a61d44dd1b       200       2024  132.6446
#> 2  bc56286f-b6a0-48c0-826a-97ce21b50de6       200       2024  132.6447
#> 3  417bda37-fd35-44be-9c15-a89ed40eb28d       200       2024  132.6445
#> 4  a2823989-8451-4982-9ba4-27dca5f21a38       200       2024  132.6441
#> 5  d41c3920-d3ec-4bde-b461-c207d77d9b11       200       2024  132.6437
#> 6  78d5397b-1a63-4257-8b01-aa365bfb5138       200       2024  132.6434
#> 7  5af7e914-38d6-4e5d-867b-c0ab2d8f904a       200       2024  132.6436
#> 8  1b0126bd-6869-4986-a5bf-8c59939ed50d       200       2024  132.6420
#> 9  be6c809a-2b57-4a79-b123-1dd6669e0221       200       2024  132.6421
#> 10 58f4149a-273b-4b4a-95c9-1ac353580619       200       2024  132.6423
#>    point_lat        key land_type_jp local_government_cd
#> 1   33.88813 3820102004           畑              382019
#> 2   33.88768 3820102004           畑              382019
#> 3   33.88746 3820102004           畑              382019
#> 4   33.88755 3820102004           畑              382019
#> 5   33.88740 3820102004           畑              382019
#> 6   33.88729 3820102004           畑              382019
#> 7   33.88770 3820102004           畑              382019
#> 8   33.88782 3820102004           畑              382019
#> 9   33.88792 3820102004           畑              382019
#> 10  33.88765 3820102004           畑              382019
#>                          geometry
#> 1  MULTIPOLYGON (((132.6446 33...
#> 2  MULTIPOLYGON (((132.6444 33...
#> 3  MULTIPOLYGON (((132.6448 33...
#> 4  MULTIPOLYGON (((132.6442 33...
#> 5  MULTIPOLYGON (((132.6437 33...
#> 6  MULTIPOLYGON (((132.6434 33...
#> 7  MULTIPOLYGON (((132.6435 33...
#> 8  MULTIPOLYGON (((132.6418 33...
#> 9  MULTIPOLYGON (((132.6422 33...
#> 10 MULTIPOLYGON (((132.6422 33...You can review Fude Polygon data in detail.
library(shiny)

s <- shiny_fude(db, community = TRUE)
# shiny::shinyApp(ui = s$ui, server = s$server)
This feature was heavily inspired by the following website: https://brendenmsmith.com/blog/shiny_map_filter/.
mapview packageIf you want to use mapview(), do the following.
db1 <- combine_fude(d, b, city = "伊方町")
db2 <- combine_fude(d, b, city = "八幡浜市")
db3 <- combine_fude(d, b, city = "西予市", kcity = "三瓶|二木生|三島|双岩")

db <- bind_fude(db1, db2, db3)

library(mapview)

mapview::mapview(db$fude, zcol = "RCOM_NAME", layer.name = "農業集落名")