![]()
![]()
![]()
![]()
An R-package for analyzing natural language implementing Differential
Language Analysis using words, phrases and topics.
Check out
our tutorial paper: Multiple Methods for
Visualizing Human Language: A Tutorial for Social and Behavioural
Scientists. If you use the topics package, please cite this tutorial
in your work.
The topics package is part of the
R Language Analysis Suite, including talk,
text and topics.
talk transforms
voice recordings into text, audio features, or embeddings.text provides
many language tasks such as converting digital text into word
embeddings.talk and text offer
access to Large Language Models from Hugging Face.topics
visualizes language patterns into words, phrases or topics to generate
psychological insights. topics package supports
the text package in analysing and visualizing topics from
BERTtopics.
When using the topics package, please cite:
Ackermann L., Zhuojun G. & Kjell O.N.E. (2024). An R-package for
visualizing text in topics. https://github.com/theharmonylab/topics.
DOI:zenodo.org/records/11165378.
📣 Online Workshop: Analysing Human Language using R
August 11–13, 2026 — three half-day sessions (2:00–5:00 pm CEST / 8:00–11:00 am ET)
Learn the full R Language Analysis Suite —
talk,text, andtopics— with Oscar Kjell.
The topics pipeline is designed for a seamless
transition from raw text to statistically grounded visualizations. It is
composed of the following steps:
1. Data Preprocessing Transform raw text into a Document-Term Matrix (DTM) or extract n-grams. This step handles cleaning, including the removal of stopwords and punctuation, to prepare data for modeling or frequency analysis.
2. Model Training For topic modeling, an LDA (Latent Dirichlet Allocation) model is trained on the DTM. Users can specify the number of topics and iterations to optimize the thematic representation of the corpus.
3. Model Inference The model inference step uses the trained LDA model to infer the topic-term distribution across documents, converting qualitative text into quantitative topic loadings.
4. Statistical Analysis Perform Differential
Language Analysis (DLA) using topicsTest(). The analysis
now supports: * Automatic Detection: Intelligent
per-variable method detection (e.g., automatically applying logistic
regression for binary factors and linear regression for continuous
data). * Multi-Element Analysis: Statistically test
both LDA topics and n-grams. * Rigorous Controls:
Support for control variables and various p-value adjustment methods for
multiple comparisons (e.g., FDR, Bonferroni, Holm).
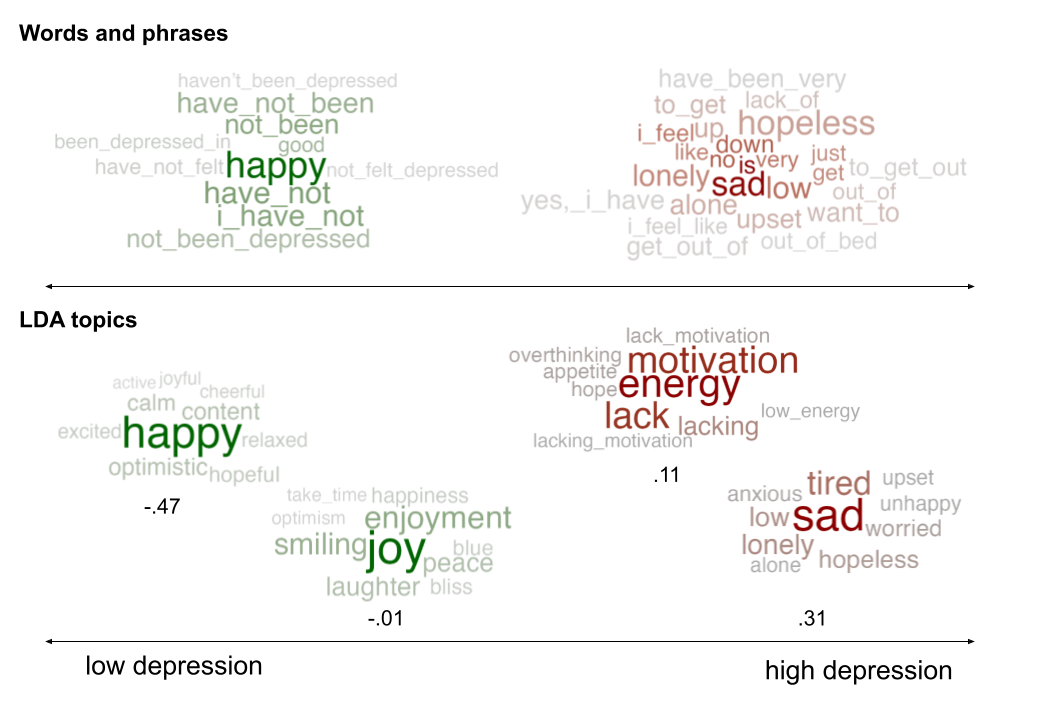
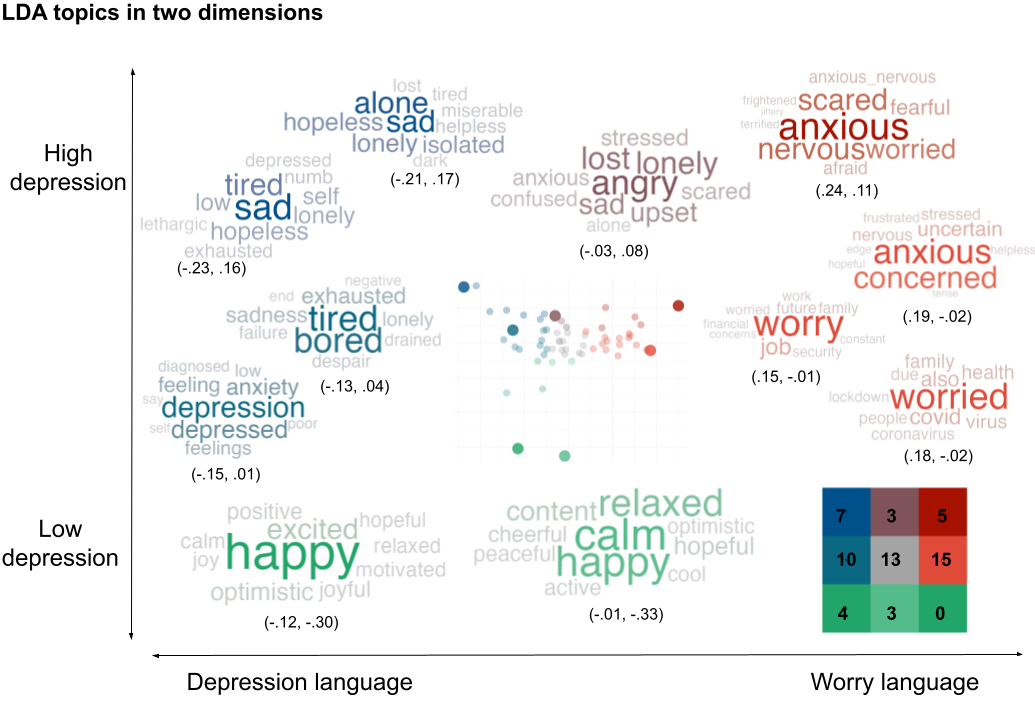
5. Visualization Generate publication-ready visualizations of your results: * Wordclouds: Create clouds of significant topics where word size reflects the contribution to the theme. * N-gram Plots: Directly visualize the relationship between specific phrases and your variables of interest.